I have an app that I made with yeoman, grunt an angular JS (typical setup - image included below). I'm trying to debug my project with spyjs (or even regular javascript debugging) but I can't seem to get it working when I run "grunt serve" - the file that's loaded from WebStorm clearly isn't going through the grunt server (but localhost:63343 instead). Any ideas how I could configure things properly to get debugging to work?

Here's my SpyJS configuration:

I've also tried localhost:9000 for the URL to trace (which is the port that grunt serve runs on), and I've tried using another node interpreter.
You need using the server your client code runs on (localhost:3000) and not WebStorm built-in webserver to debug your Angular application served by Grunt. See Debugging grunt with Intellij for some hints
Note: haven't tried this with spyjs - only with a regular debugger
You need to upgrade to Webstorm 9. As per spy-js
Node.js tracing is now supported in WebStorm 9 EAP, including multi process and node cluster tracing support.
Then instead of using Spy-js profile, use Spy-js for Node.js profile.
This screenshot is from Webstorm 9 RC.

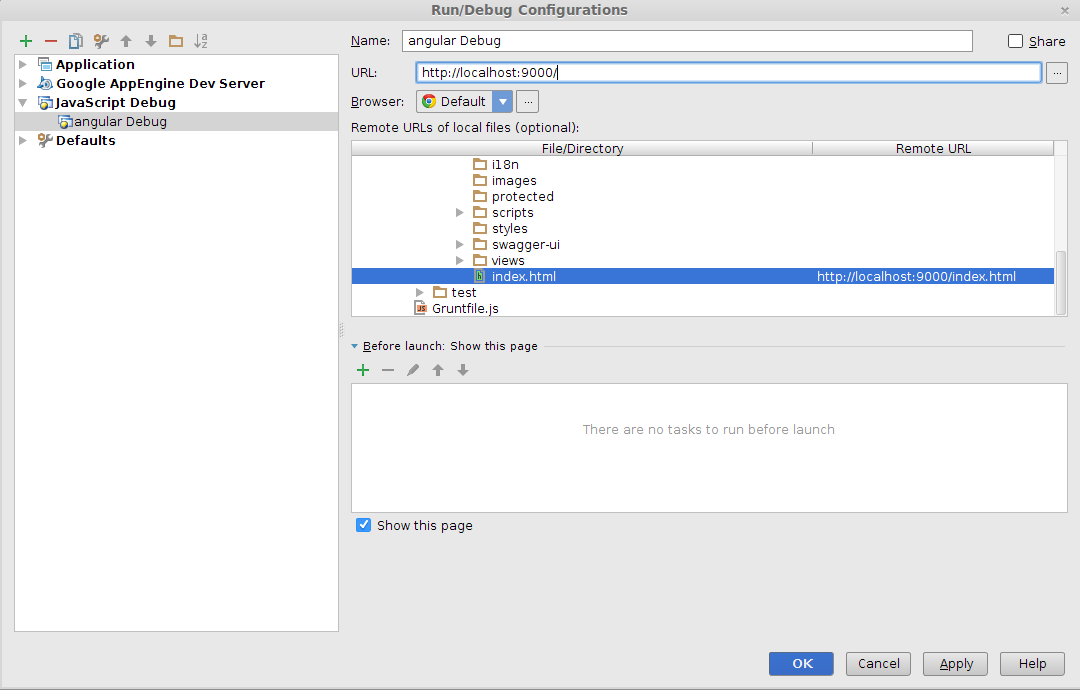
I am using too the Yeoman generator (AngularJs + grunt), and I am debugging the application using the JavaScript Debug configuration like this:
 Have a look to this post about how to debug angularJS with Intellij (It should work too for web storm)